For U.S. news junkies, the first name that comes to mind when you hear “data journalism” is FiveThirtyEight. This predictive analytics site has set the standard for data journalism in the U.S. since it launched a decade ago. Yet, the 2016 U.S. presidential election proved the fallibility of data journalism, even from a megalith like FiveThirtyEight.
The poll aggregation website is the brainchild of Nate Silver, who came up with the idea after identifying an analytical void in political coverage leading up to the 2008 U.S. presidential election. That inaugural year, FiveThirtyEight accurately predicted Obama’s election. Four years later, not only did FiveThirtyEight predict Obama’s re-election, Silver correctly predicted the results from all 50 states.
The success of FiveThirtyEight lies in the combination of its accuracy and its accessibility. Silver is a brilliant predictive analyst, but he also found a way to meld the insights he gleaned from big data into a journalistic platform that doesn’t go over the heads of the average reader. Consequently, people paid attention.
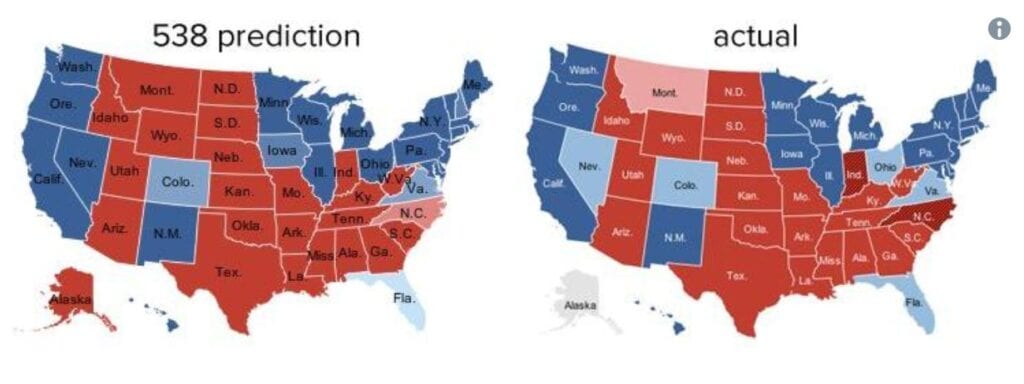
For a decade, Silver’s predictions were polling gospel. In 2016, he predicted a Clinton victory. Only this time, human fallibility triumphed over predictive data. But where data fell short, journalism picked up the slack. In an election series post-mortem, Silver wrote eleven investigative pieces examining “The Real Story of 2016.”

As evident by each headline, the series paints the full picture of the 2016 election, not just the story the data told. FiveThirtyEight’s faltering is a reminder why consumers can acknowledge the analytic importance of data journalism without accepting it as scripture.